Rankings
Individual Rankings
In all cases, players are ranked in order of NCTTA individual rating.
Doubles Rankings
Doubles pairs are ranked based on the sum of both players' NCTTA individual ratings.
Team Rankings for Qualification
For purposes of wild card qualification to Regional and National competitions, teams are ranked based on each team's calculated team rating. Team rating is found by taking the NCTTA ratings of the four highest-rated players on the team (players A, B, C, and D, in order), and calculating: [1.5 * (A + B) + C + D]. If the team has only three players, the team rating will be [A + B + C].
Team Seeding
At Divisional and Regional competitions, teams are seeded based directly on team ranking.
At the Championships, teams are seeded by running a simulated giant round robin of all qualified teams. The winner of the simulation becomes the first seed; the second place finisher of the simulation becomes the second seed; etc.
Simulation of Team Lineups
During actual competition, teams may select any four players from their roster to play in a given team contest.. For purposes of the simulation, it is assumed that the four highest-rated players from each team are always chosen.
The order of the four players may change depending on the team's strategy, however there are a limited number of ordered lineups which are considered superior to other lineups. In the simulation, it is assumed that only those lineups are used.
Designating the four players on a team in ranking order as players 1, 2, 3, and 4; here are the likely lineups for a strong team:
| Case 1 | Case 2 | Case 3 | Case 4 | Case 5 | Case 6 | Case 7 | Case 8 | Case 9 | Case 10 | Case 11 | Case 12 | |
| Match #1 | 1 | 1 | 1 | 1 | 1 | 1 | 2 | 2 | 2 | 2 | 2 | 2 |
| Match #2 | 2 | 2 | 3 | 3 | 4 | 4 | 1 | 1 | 3 | 3 | 4 | 4 |
| Match #3 | 3 | 4 | 2 | 4 | 2 | 3 | 3 | 4 | 1 | 4 | 1 | 3 |
| Match #4 | 4 | 3 | 4 | 2 | 3 | 2 | 4 | 3 | 4 | 1 | 3 | 1 |
| Doubles | 1+2 | 1+2 | 1+2 | 1+2 | 1+2 | 1+2 | 1+2 | 1+2 | 1+2 | 1+2 | 1+2 | 1+2 |
There is one more type of lineup that may be considered viable: having player 4 as match #1, with the strategy of attempting to win three singles matches. Though such a lineup can be effective in specific situations, in most cases it would be used by the team that is not favored to win. The intention of the simulated round robin is to find which team is favored to win, therefore this alternate lineup will not be considered in the simulation.
A strong team will likely select one of these 12 lineups during actual competition. A computer cannot guess which lineup will be used, therefore when simulating a team contest between two teams, all combinations will be considered. The simulation will evaluate all 144 lineup combinations between the two teams, and determine the winner of the team contest based on the average result.
Simulation of Individual Matches
In a singles match between two rated players, the higher rated player is favored to win. In singles seeding, it is clear that a higher rated player should be seeded higher than a lower rated player, regardless of how far apart the two ratings are. However in a team contest, the difference in rating between the two players should be considered.
For example a player rated 2301 is always seeded higher than a player rated 2300, however the actual likelihood of the 2301 player winning the match is only slightly higher than 50%, and this is accounted for in team seeding.
To see how this manifests in team competition, consider a contest between two teams with players of the following ratings:
| Team A | Team B | Probable winner | Score | Win Chance | Weighted Score | |
| Match #1 | 2301 | 2300 | A | A: 1, B: 0 | 50.3% A, 49.7% B | A: 0.503, B: 0.497 |
| Match #2 | 2000 | 2250 | B | A: 0, B: 1 | 0% A, 100% B | A: 0, B: 1.000 |
| Match #3 | 1850 | 1800 | A | A: 1, B: 0 | 66.7% A, 33.3% B | A: 0.667, B: 0.333 |
| Match #4 | 1850 | 1800 | A | A: 1, B: 0 | 66.7% A, 33.3% B | A: 0.667, B: 0.333 |
| Doubles | 4301 | 4550 | B | A: 0, B: 1 | 0% A, 100% B | A: 0, B: 1.000 |
| Final Score | A: 3, B: 2 | A: 1.837, B: 3.163 |
A simulation that uses simple wins and losses would predict team A to be the winner of this contest, by a score of 3 to 1. However based on how close the ratings are, there is a greater than 50% chance that team B will win one of matches #1, #3, or #4 by upset. Therefore team B is actually more likely to win this contest, and this prediction is reflected in the Weighted Score column.
The probability that one player will beat another player can be calculated by using an inverted ratings chart.
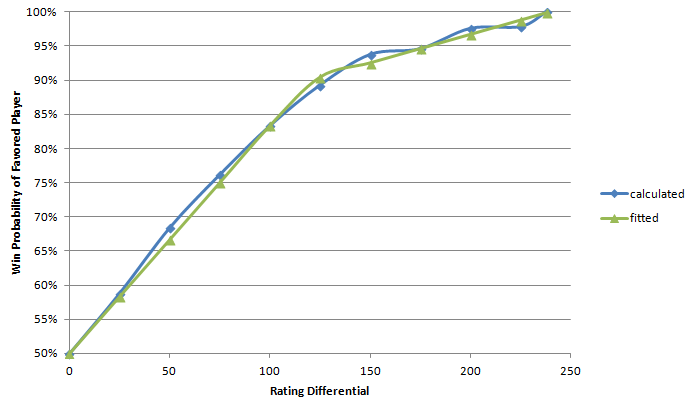
Based on the rating point exchange table, the blue line in the graph below shows the smoothed probability that a higher rated player will win a singles match against a lower rated player, depending on the difference between the two players' ratings.

The blue line is difficult to encapsulate in a single formula, but it can be approximated with the following:
- If the rating differential is greater than 240, the higher rated player always wins (100%)
- If the rating differential is greater than 120, the higher rated player has a chance of winning calculated by: 0.5 + 120/300 + (differential - 120) / 1200
- Otherwise, the higher rated player has a chance of winning calculated by: 0.5 + differential / 300
The result of this formula is shown in the graph above as the green line. The team seeding uses this calculation to predict match result probability.
Group Simulation
All teams which qualify for the Championships are placed in a simulated giant round robin; all coed teams in one giant group, and all women's teams in another giant group. Each team is simulated to play against every other team, and the round robin results are figured by awarding match points as follows: 2 match points for a win, 1.5 match points for a tie, and 1 match point for a loss. For the purposes of the simulation, a team must win by a score of at least 3-2 to be granted a win; a score of 2.9-2.1 is considered a tie.
Bonus Points
After the team match points are calculated, bonus points are added based on the team's final placement during regional competition, as follows:
1st Place: 4 bonus match points
2nd Place: 2 bonus match points
Final Seeding
After bonus points are added, teams are ranked in order of total match points. Ties are broken by standard tiebreaking rules. For tiebreaking purposes, a score higher than 2.5 (e.g. 2.51-2.49) is considered a win.
Example
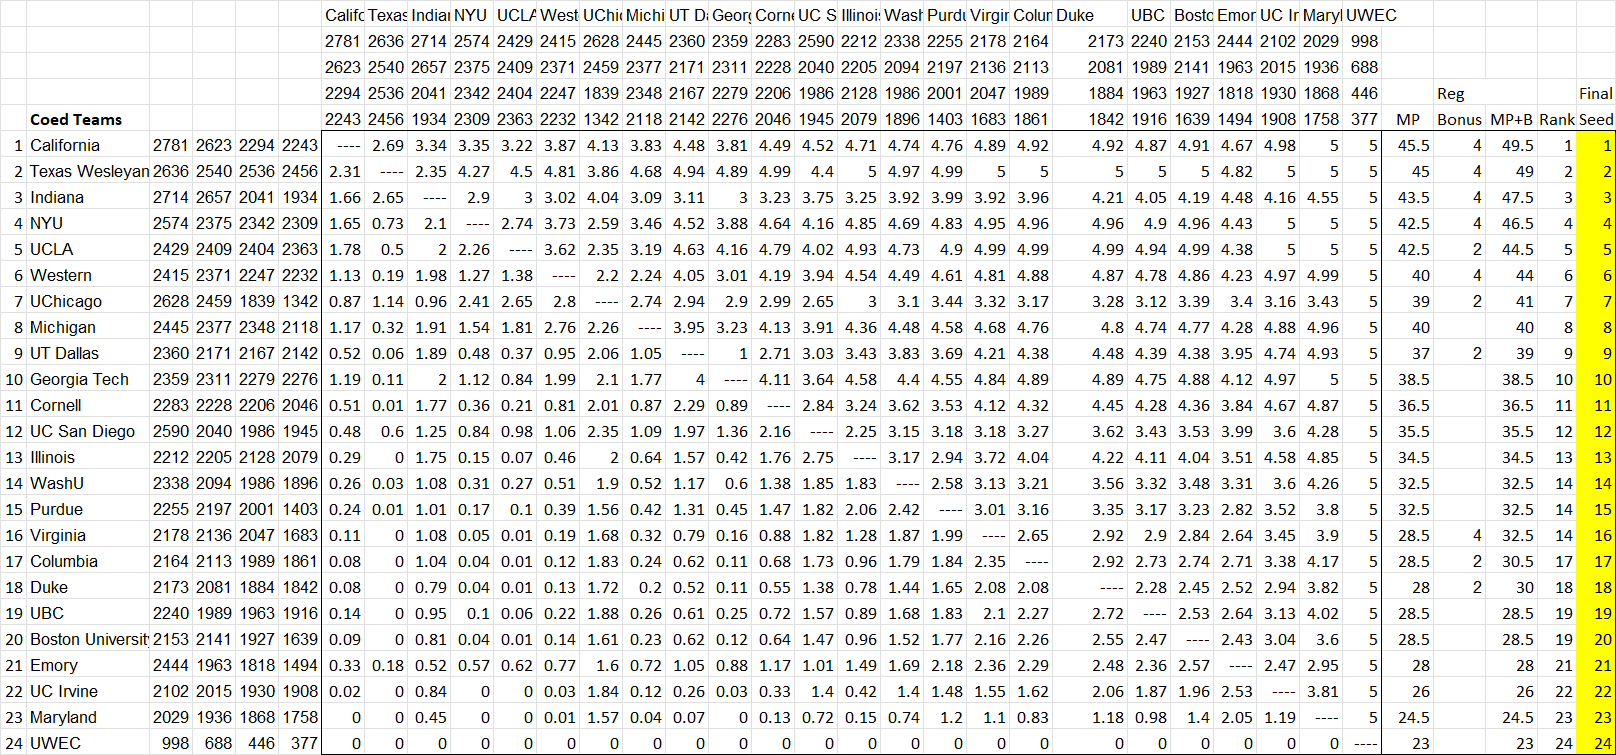
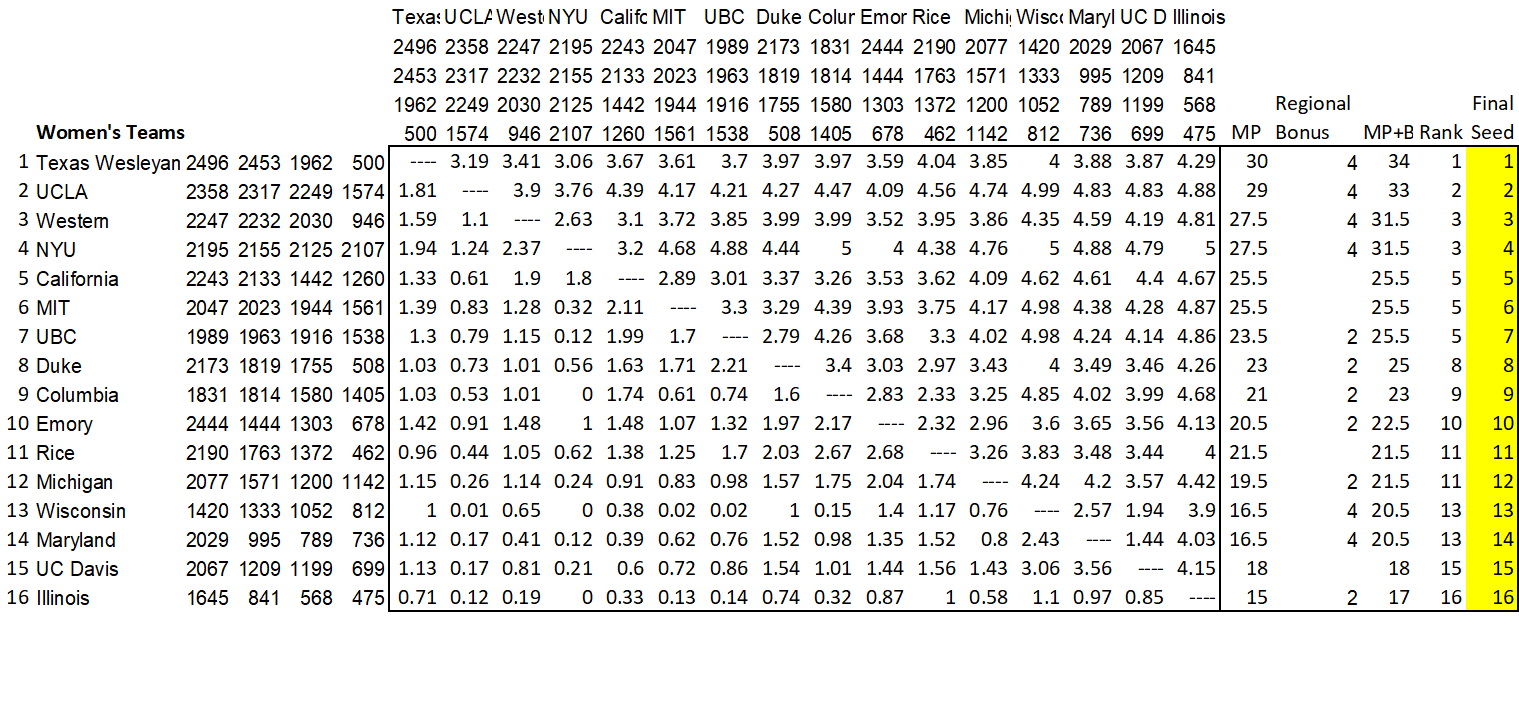
Here's how the 2024 championship seedings have been calculated, using this system:


